
Several experiments to test the influence of different factors have been carried out on the temperature network Tm2, which has an intermediate level of cross-correlations:
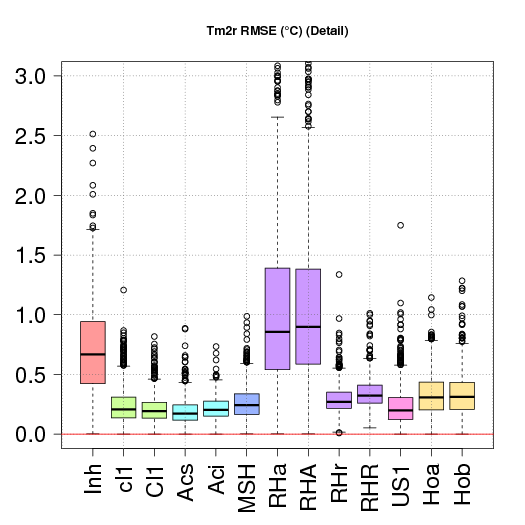
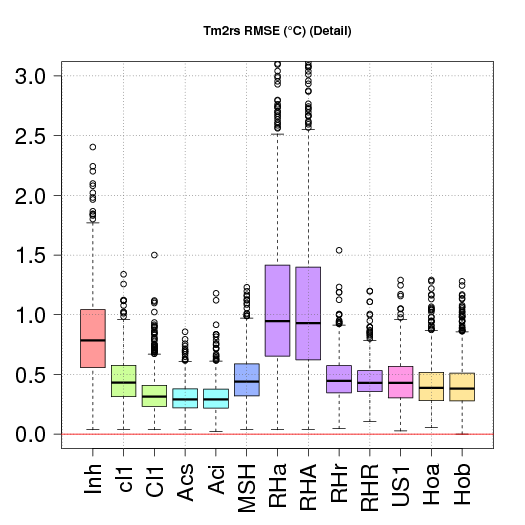
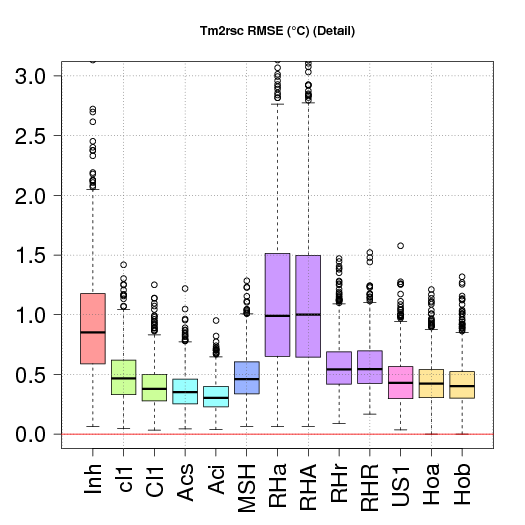
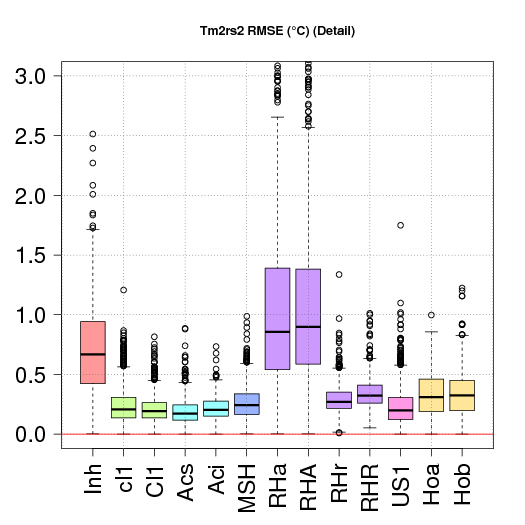
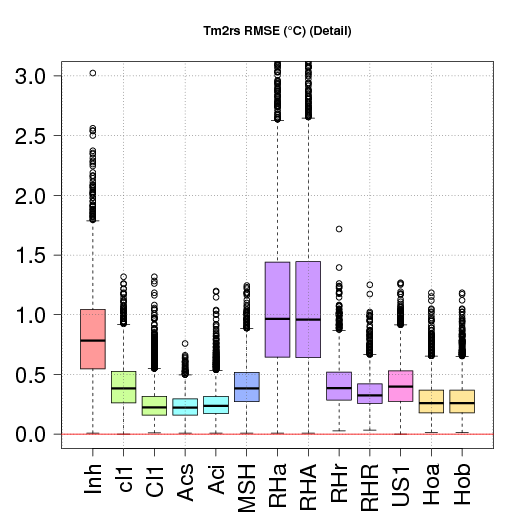
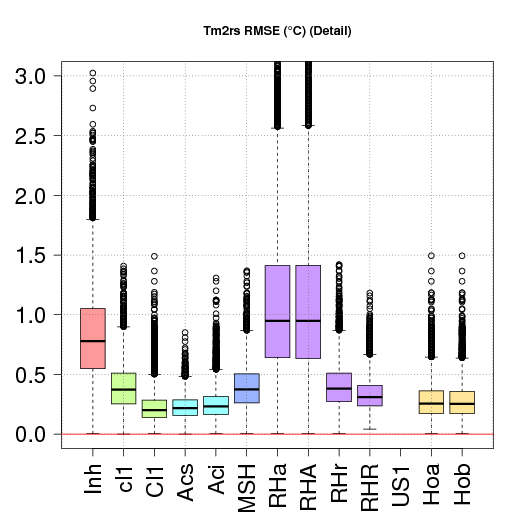
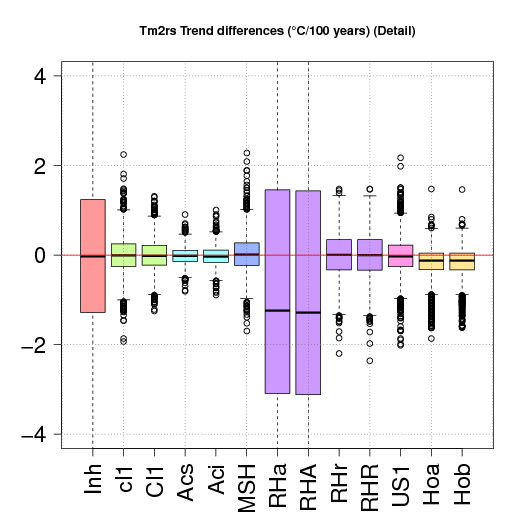
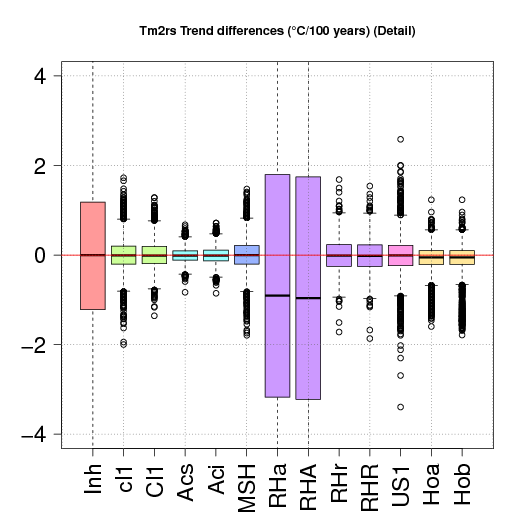
Anomalous biases in the series can be constant or show a seasonality (have different values along the year). Four different scenarios have been tested to check the performance of the homogenization packages under different conditions:
| None | Sinusoidal | Squared | Double sinus. |
|---|---|---|---|
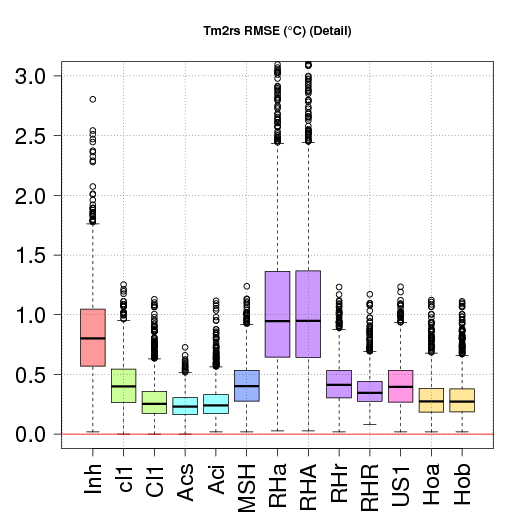
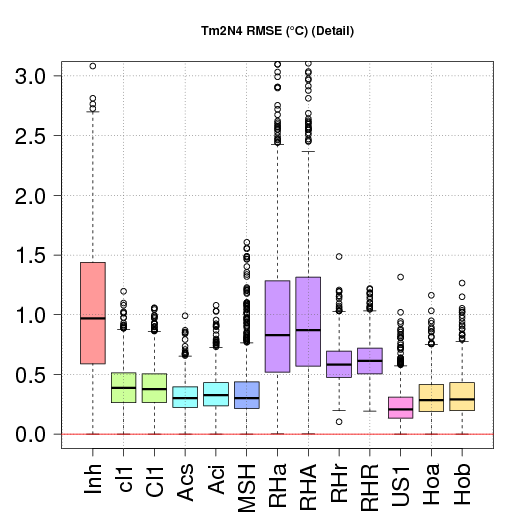
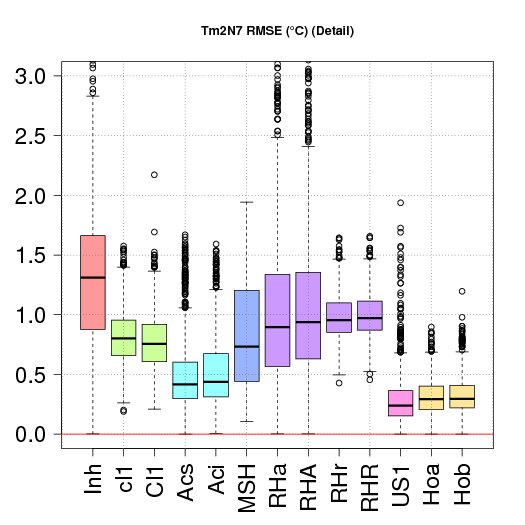
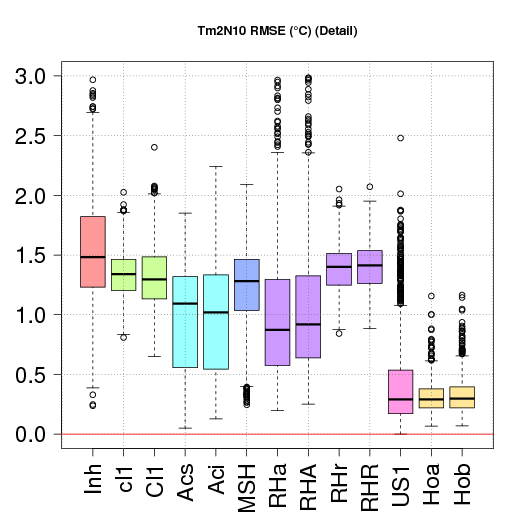
| Root mean square errors | |||
|
|
|
|
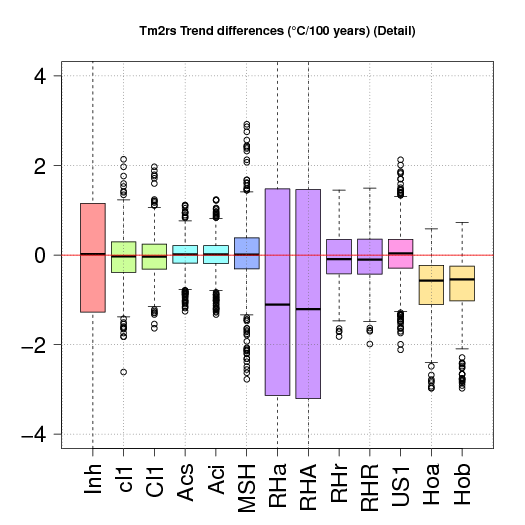
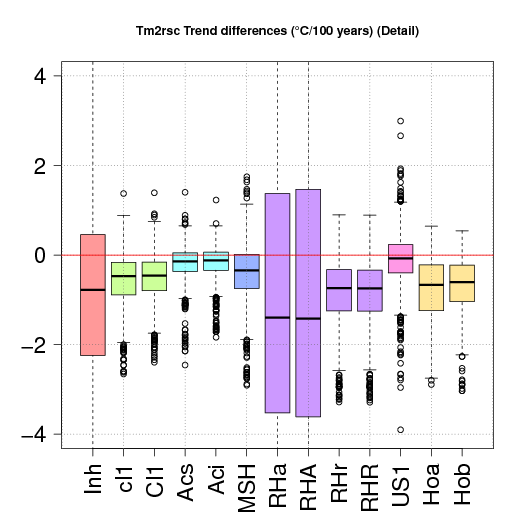
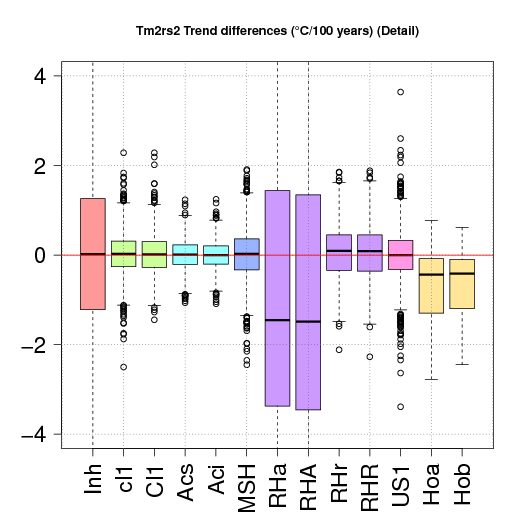
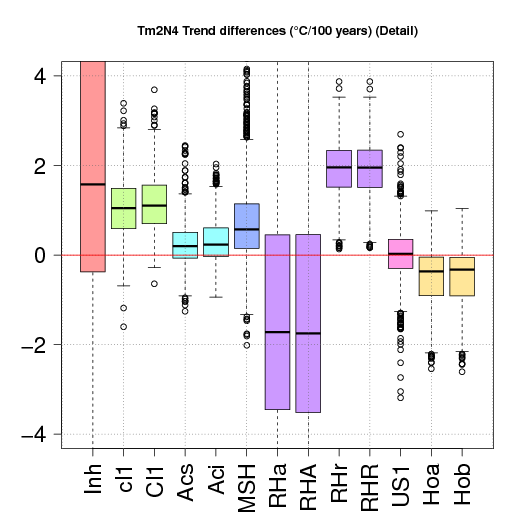
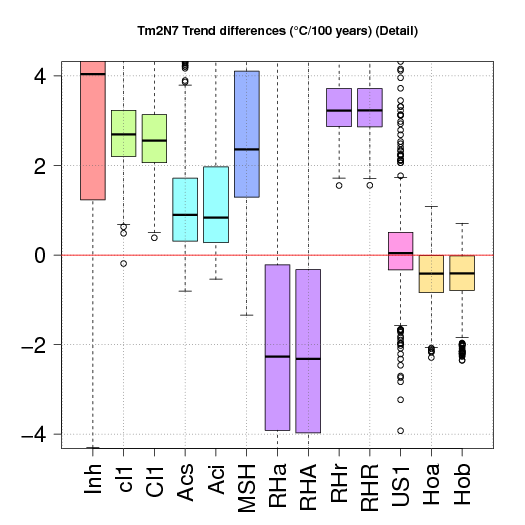
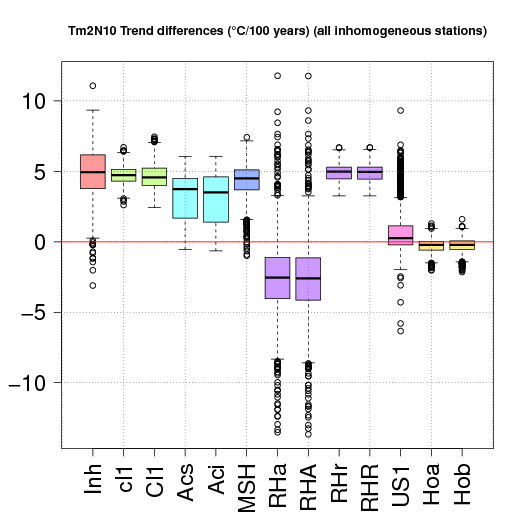
| Trend errors | |||
|
|
|
|
The influence of sample size is tested with samples of 10, 20, 40 and 80 series of the Tm2 master network, with random inhomogeneities in all series with sinusoidal seasonality of random amplitude. (USHCN could not be tested for 80 series because the compilation was done for a maximum of 40 series, and new compilation attemps were unsucessful.)
| 10 series | 20 series | 40 series | 80 series |
|---|---|---|---|
| Root mean square errors | |||
|
 |
 |
 |
| Trend errors | |||
|
 |
 |
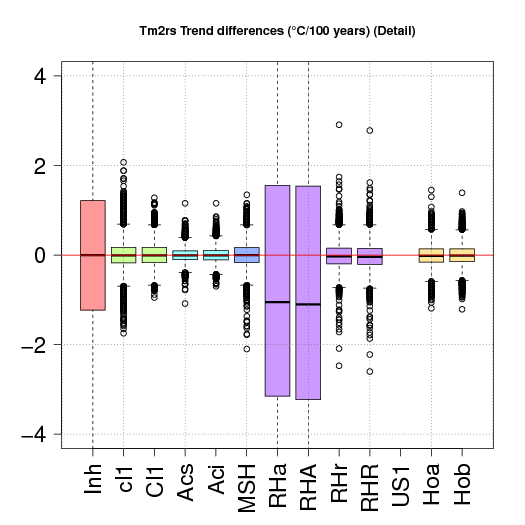 |
Changes in observational methods or instruments can take place during a short period of time and affect a high proportion if not all of the stations in a network. Examples can be the transitions from an old fashioned thermometer screen to the Stevenson type or, more recently, from manual to automated stations. When these changes are applied simultaneously to all the network, no relative homogenization procedure can detect the biases, since they would appear as part of the climate variability. Here 2°C shifts have been added, uniformely distributed over a decade, to 40, 70 and 100% of the Tm2 series with random inhomogeneities and random amplitude sinusoidal seasonalities. (Results without these added shifts are shown in the left column for comparison.)
| 0 % | 40 % | 70 % | 100 % |
|---|---|---|---|
| Root mean square errors | |||
|
 |
 |
 |
| Trend errors | |||
|
 |
 |
 |